General Overview
What Is io.Insights?
io.Insights is a light-weight and agile solution for publishing signals (metrics, traces and logs) based on the widely adopted OpenTelemetry standard. It's implemented as a configurable built-in feature of io.Connect Desktop and io.Connect Browser and provides a wide array of default platform metrics, extensive trace instrumentation, and an Insights API for publishing telemetry data from your interop-enabled apps.
Using the OpenTelemetry standard as the implementation basis of io.Insights is in alignment with industry standards and ensures interoperability with a wide range of visualization tools and platforms that have already adopted the standard. This makes io.Insights easily pluggable into existing client infrastructure, without the need for developing and deploying custom components for collecting and storing data.
⚠️ Note that the following sections describe the new implementation of the io.Insights product based on the OpenTelemetry standard. For details on the legacy implementation and the legacy Metrics APIs used for publishing metrics, see the Legacy io.Insights section.
Why Use io.Insights?
To improve the efficiency of your business processes, you often find the need to collect extensive data about the daily workflows and routines within your company. You want to see the specific actions your employees take and the choices they make when achieving outstanding results or when performing poorly, as to optimize your processes or tools. The most efficient way for achieving this is through recording relevant data in the form of metrics. Metrics data is also useful for technical purposes like monitoring how well your hardware infrastructure handles the workload or tracking the performance of your apps.
Collecting traces and logs can immensely reduce the time for pinpointing potential or existing problems with your apps. Traces can also be correlated by ID with the respective metrics to further enhance your understanding of the issue and help you design the required solution.
All of this is made possible by io.Insights, no matter which platform you prefer - io.Connect Desktop or io.Connect Browser. No additional time and resources are required for deployment, no reliance on complex proprietary products - io.Insights works out of the box, offering increased flexibility and reducing costs. Configuration settings are available for fine-tuning the performance according to your specific business needs and requirements. The OpenTelemetry standard ensures that io.Insights can be effortlessly included in your existing infrastructure and connected to the backend solutions and the visualization tools you are already using. Furthermore, the standard allows you to instrument your apps to publish telemetry data.
Architecture
io.Insights comes as a built-in feature of both io.Connect Desktop and io.Connect Browser. It's a solution that only publishes signals (metrics, traces and logs) based on the OpenTelemetry standard. The process of collecting, storing and visualizing the data is handled entirely by the existing client infrastructure.
The following is a high-level architectural diagram demonstrating how io.Insights may be integrated with existing client infrastructure.
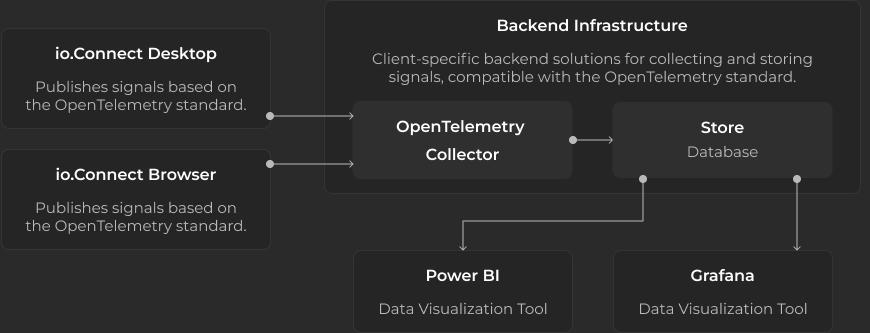
As shown in the diagram, you can use data visualization tools that natively support the OpenTelemetry standard (Grafana), as well as ones that don't (Power BI). Using data visualization solutions that don't support the standard will require additional effort for integration. For a list of vendors that natively support the OpenTelemetry standard, visit the OpenTelemetry official site.
Data Visualization
Meaningful visualization of the collected telemetry data can be a powerful tool in solving current performance problems, preventing potential ones, and identifying areas for improvement in your business processes. As already stated, visualization of the telemetry data published by io.Insights is handled entirely by clients with their preferred tools compliant with the OpenTelemetry standard, such as Grafana, Prometheus, Power BI, and others.
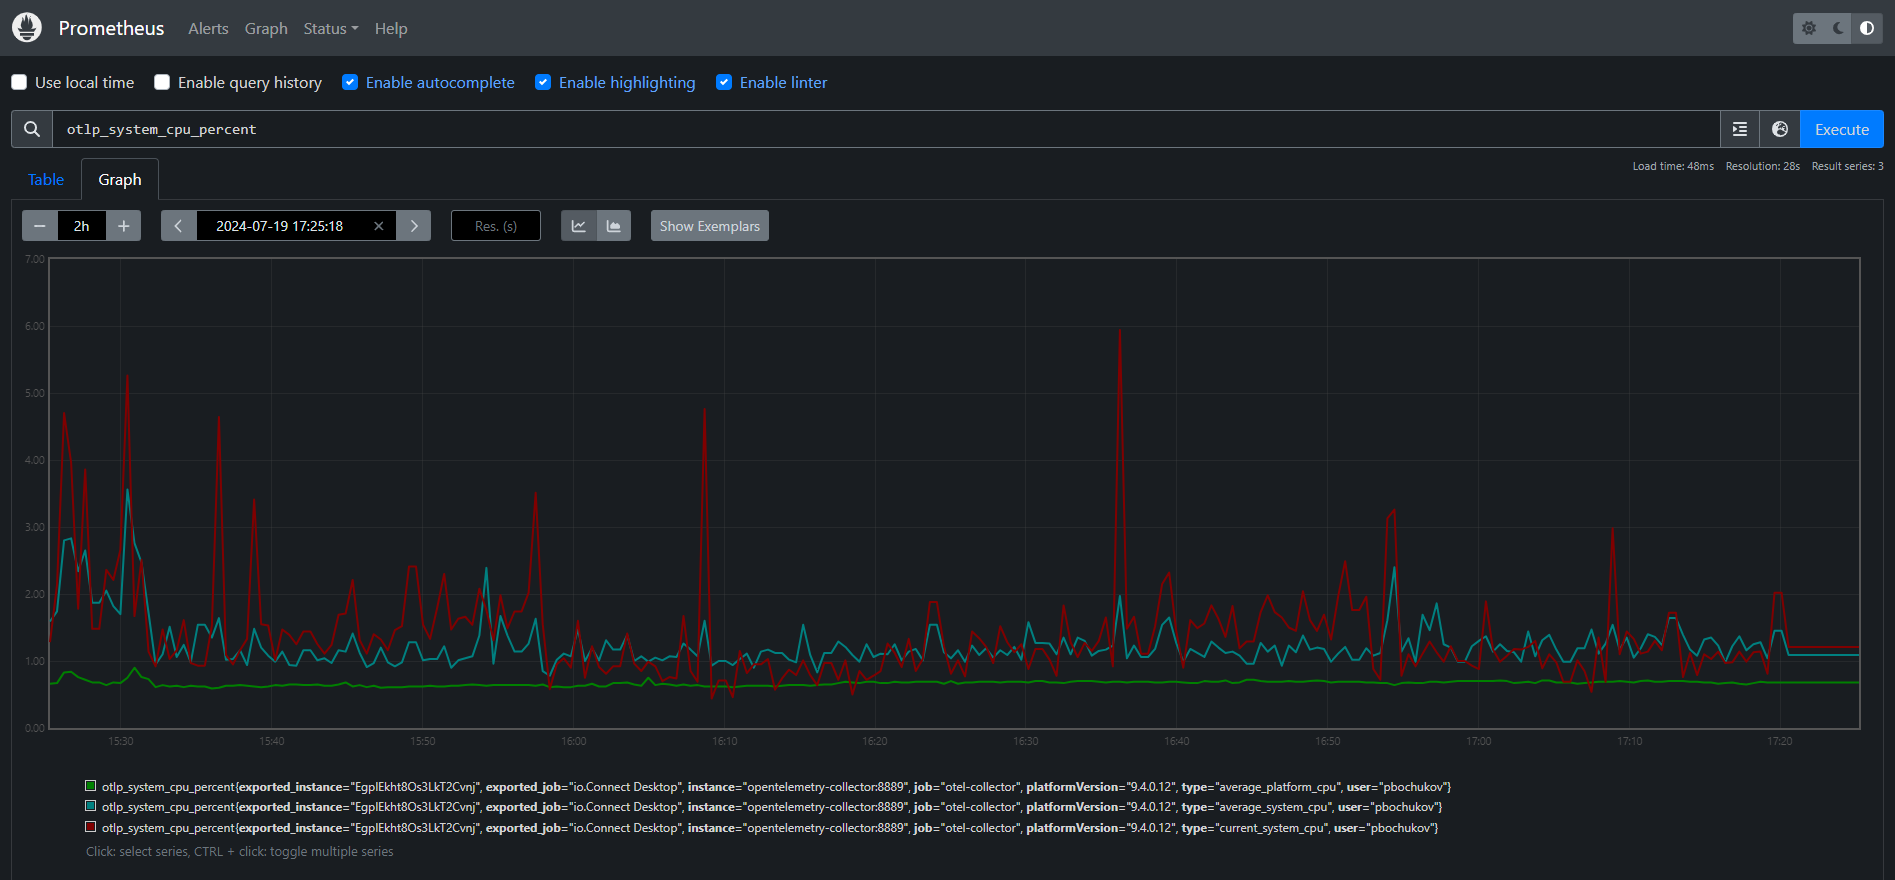
The following is an example visualization in Prometheus of data (current and average system CPU usage and average platform CPU usage) extracted from the system_cpu default metric:
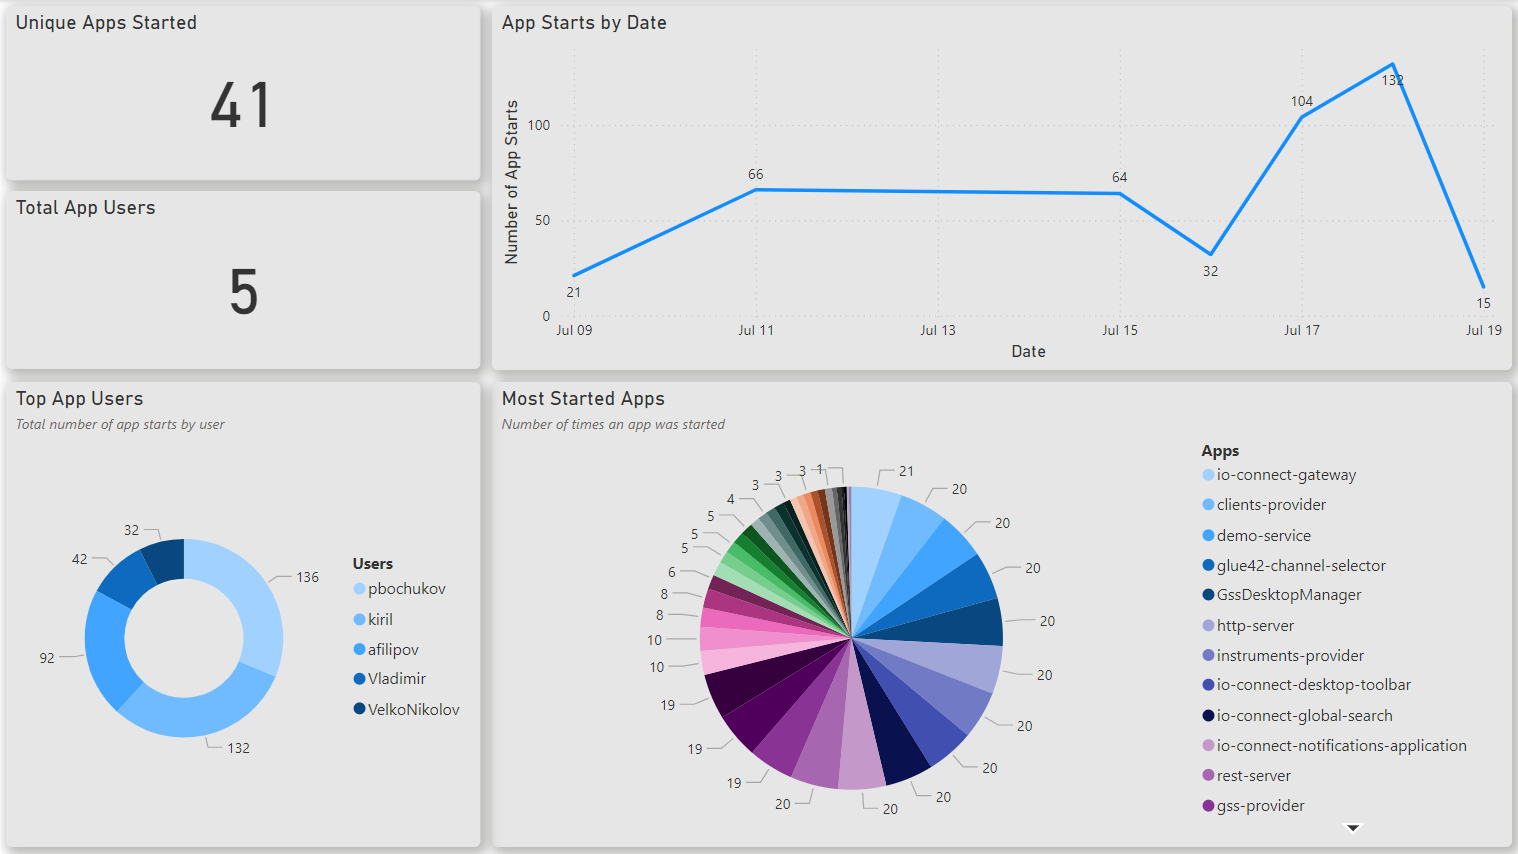
The following examples demonstrate how business-oriented visualizations of various metrics data may look like when using Power BI dashboards.
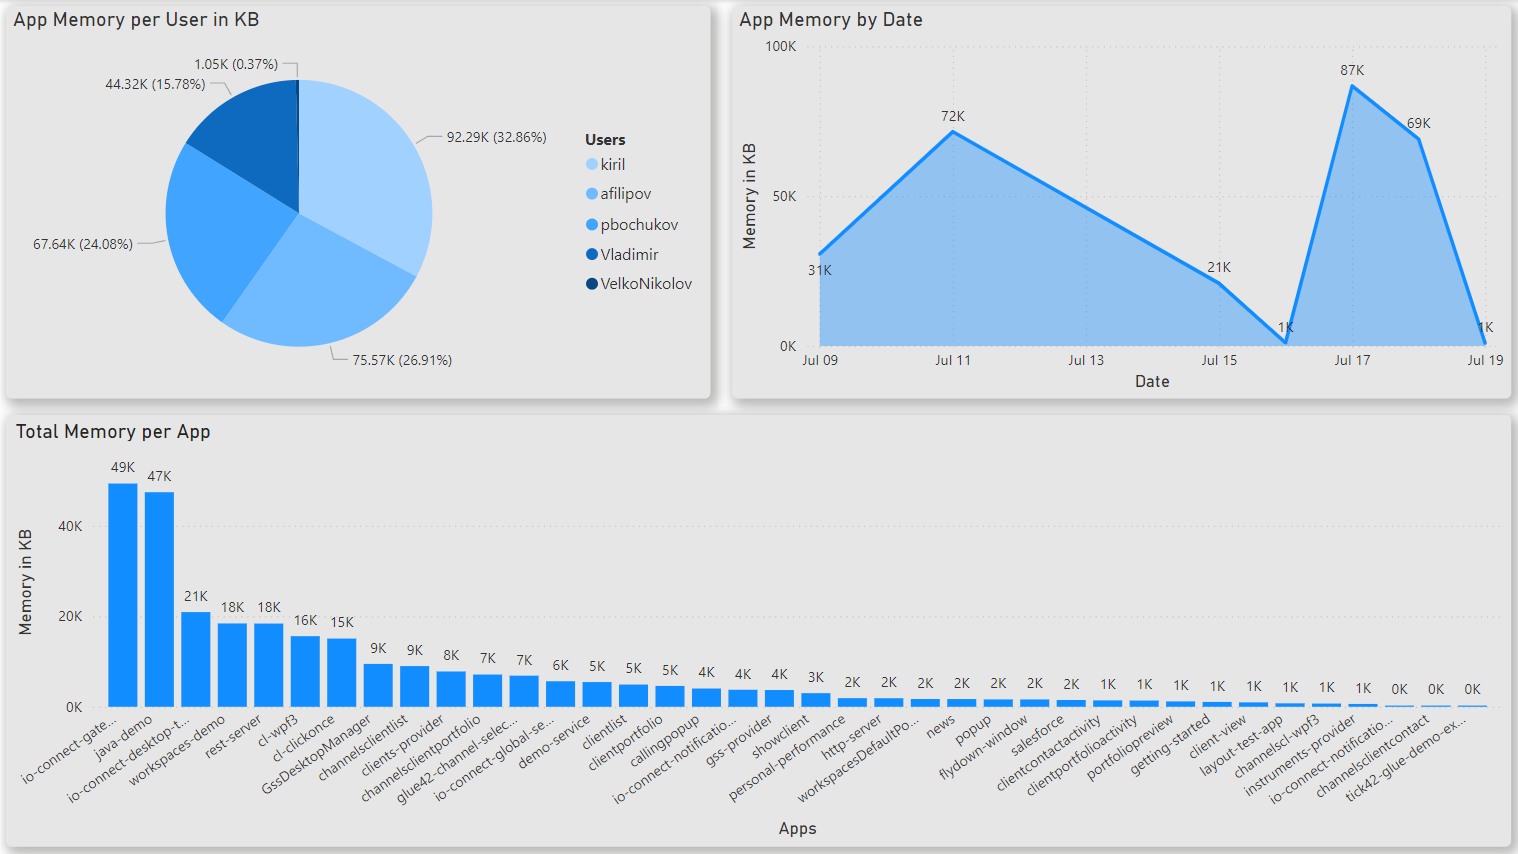
Dashboard visualizing data for app memory usage extracted from the app_memory default metric:
Dashboard visualizing data for apps started by users extracted from the app_started default metric:
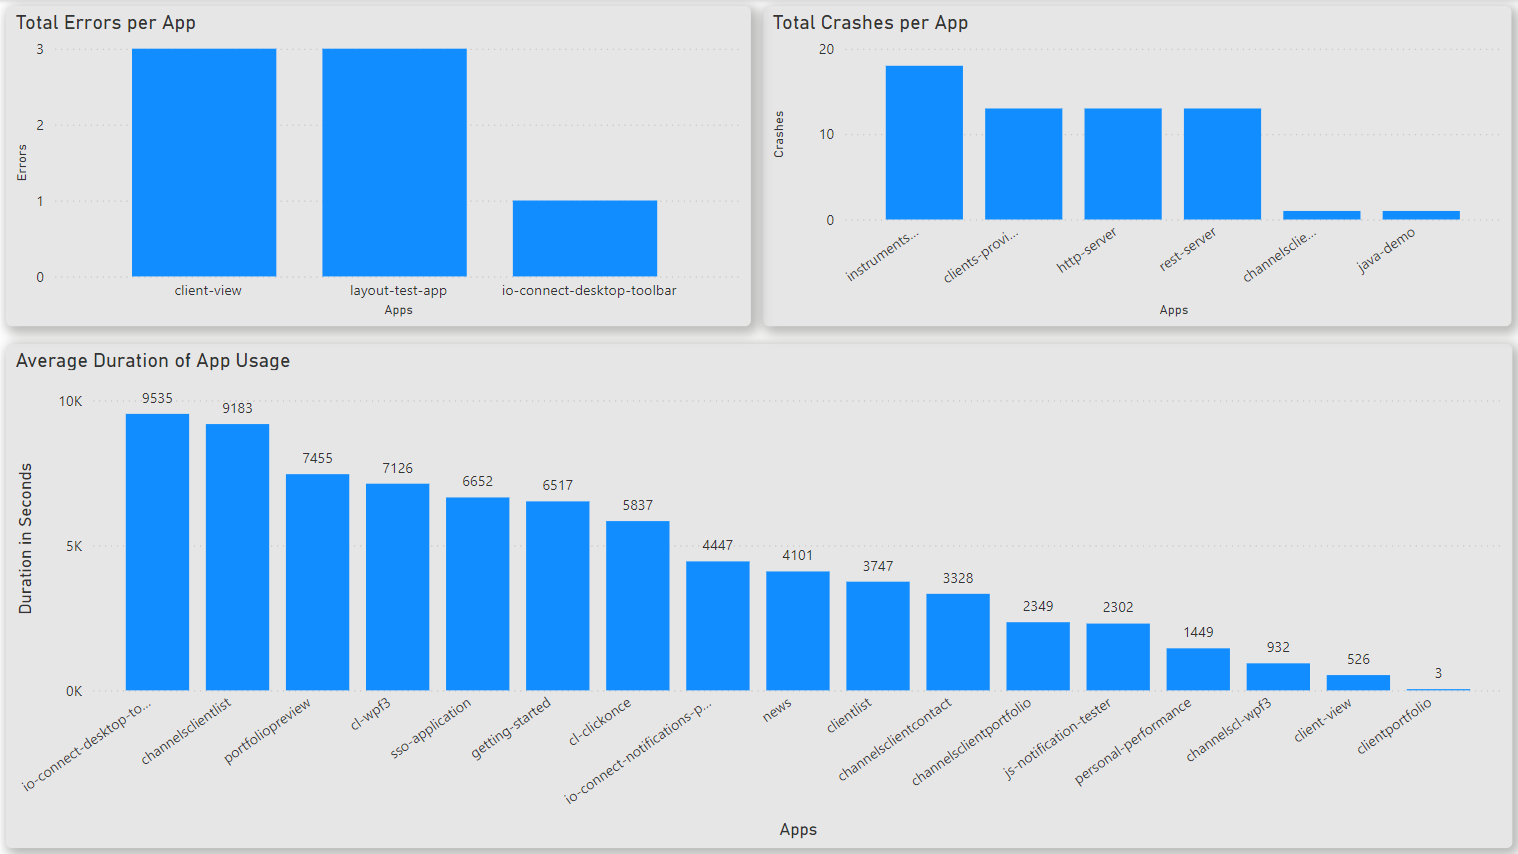
Dashboard visualizing mixed app performance data extracted from the app_errors, app_crash and app_duration default metrics: